Understanding how betting odds function is essential for anyone looking to make informed wagers and maximize value. As a seasoned bettor and industry observer, I’ve navigated everything from fractional bets at local shops to decimal odds on global platforms. In this article, we’ll demystify the mechanics behind odds formats, explore how sportsbooks set their margins, and share real-world strategies for interpreting the numbers you see on-screen. Whether you’re exploring non GamStop casinos or traditional bookmakers, these insights will help you place smarter bets.
The Foundation of Betting Odds
At its core, odds are simply a way of expressing the probability of an event happening, alongside the return you’ll receive if your bet wins. Bookmakers translate their assessments into numeric formats that resonate with different audiences:
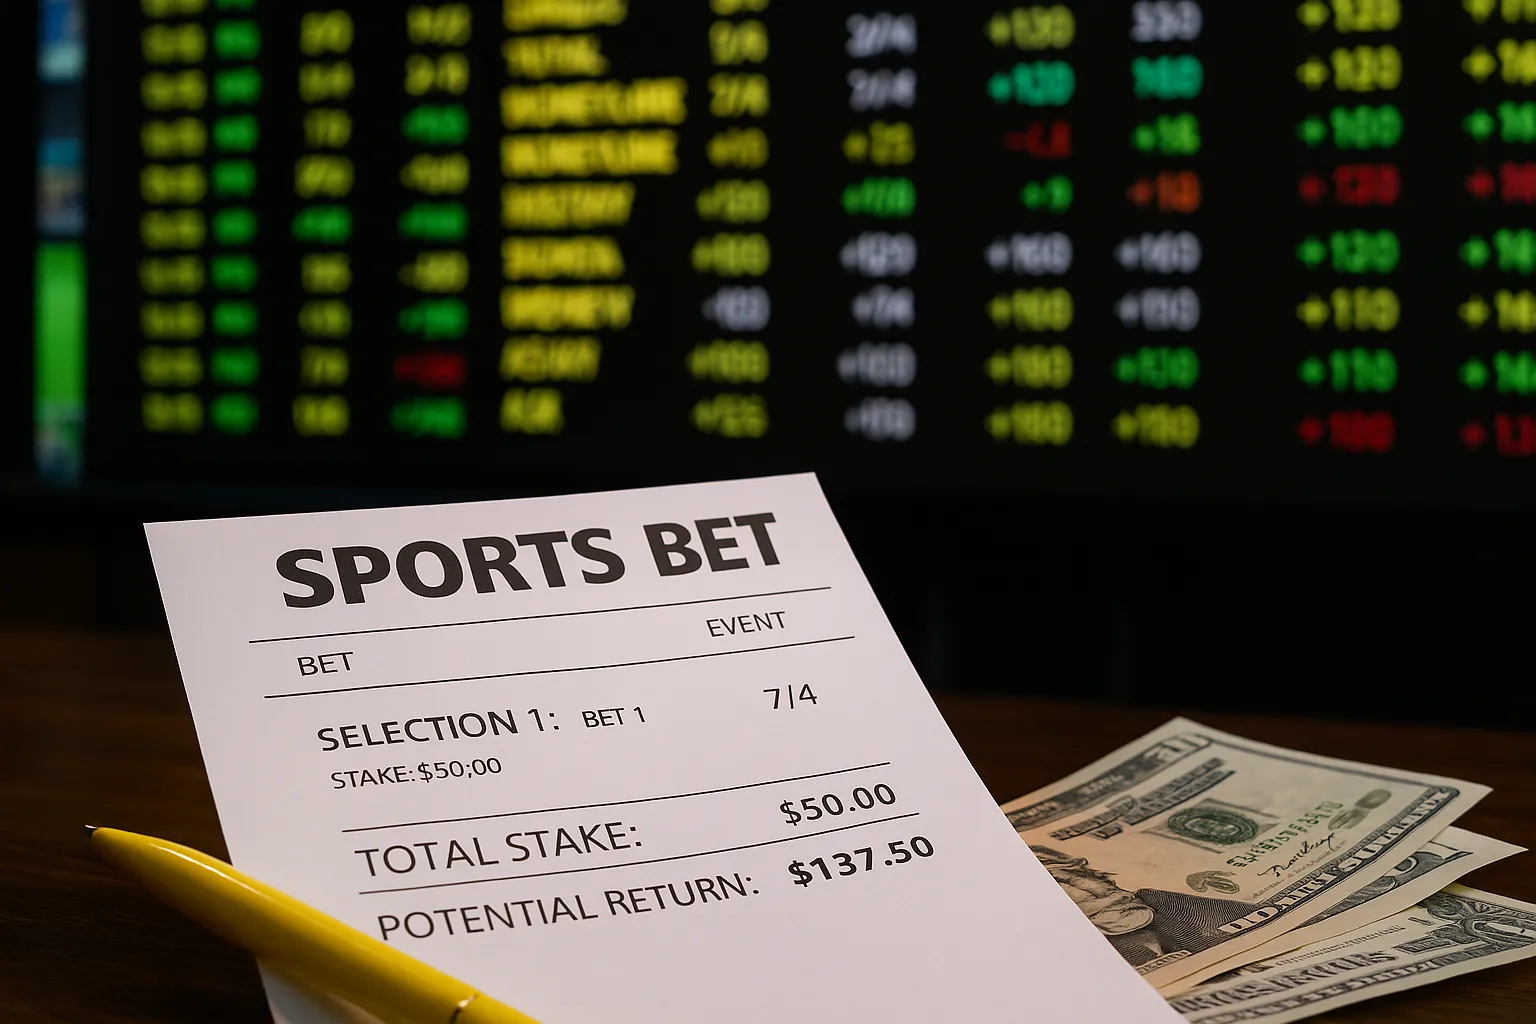
Fractional (e.g., 7/4) popular in the UK
Decimal (e.g., 2.75) widely used in Europe and Australia
Moneyline or American (e.g., +175 or –220) common in the United States
When you see odds of 7/4, that implies a 36.36% implied probability (4 ÷ (7+4)). Decimal odds of 2.75 mean a £1 stake returns £2.75 (£1 × 2.75), which equates to a 36.36% implied probability (1 ÷ 2.75). American odds of +175 indicate you’d win $175 on a $100 stake, translating to an implied probability of 36.36% (100 ÷ (175+100)). These formats differ in presentation but convey the same underlying math.
Decoding the Formats of Betting Odds
When you start comparing odds across platforms, including non GamStop casinos, you’ll notice slight variations. These differences often reflect the operator’s margin rather than true probability. Discovering the best odds means shopping around—just like you would compare prices before a big purchase.
Why Formats Matter
Choosing your preferred format can streamline your decision-making. Decimal odds simplify quick mental math, while fractional odds can feel more intuitive for traditional bettors tracking British football markets. American bettors, accustomed to plus/minus figures, have a format that highlights underdog versus favorite dynamics.
Converting Between Formats
Suppose you see fractional odds of 5/2. To convert to decimal, divide 5 by 2 and add 1, giving 3.5. To find the American equivalent for an underdog, multiply by 100: 3.5 × 100 = +250. Conversely, for a favorite, divide 100 by the decimal minus 1. Mastering these conversions helps you compare lines swiftly, ensuring you capitalize on the most favorable offers.
How Bookmakers Set Their Margins
No sportsbook operates as a charity. Operators build a profit margin—often called the overround—into every market. By summing the implied probabilities of all outcomes, you’ll typically get a figure above 100%. That extra percentage is the bookmaker’s edge.
Imagine a tennis match with two outcomes, each listed at even odds (2.00 decimal). Each implies a 50% chance, so the total is exactly 100%. In reality, a bookmaker might list one player at 1.91 and the other at 1.91. Each implies about a 52.36% chance, summing to 104.72%. That 4.72% is the overround—money the bookmaker expects to profit regardless of the result.
Balancing the Book
Skilled bookmakers adjust odds to balance liability—aiming for equal stakes on both sides. If too much money is coming in on one side, odds shift to encourage bets on the other. That dynamic pricing keeps the book balanced and protects the operator from excessive losses.
Real-World Example
In my experience, major football markets can have overrounds as low as 102% due to high liquidity and competitive pressures. Conversely, niche events or lower-tier matches might balloon to 110%+ overround, where margins compensate for lower trading volumes. Always scan multiple books to find the tightest overround when value betting.
The Role of Statistical Models and Power Rankings
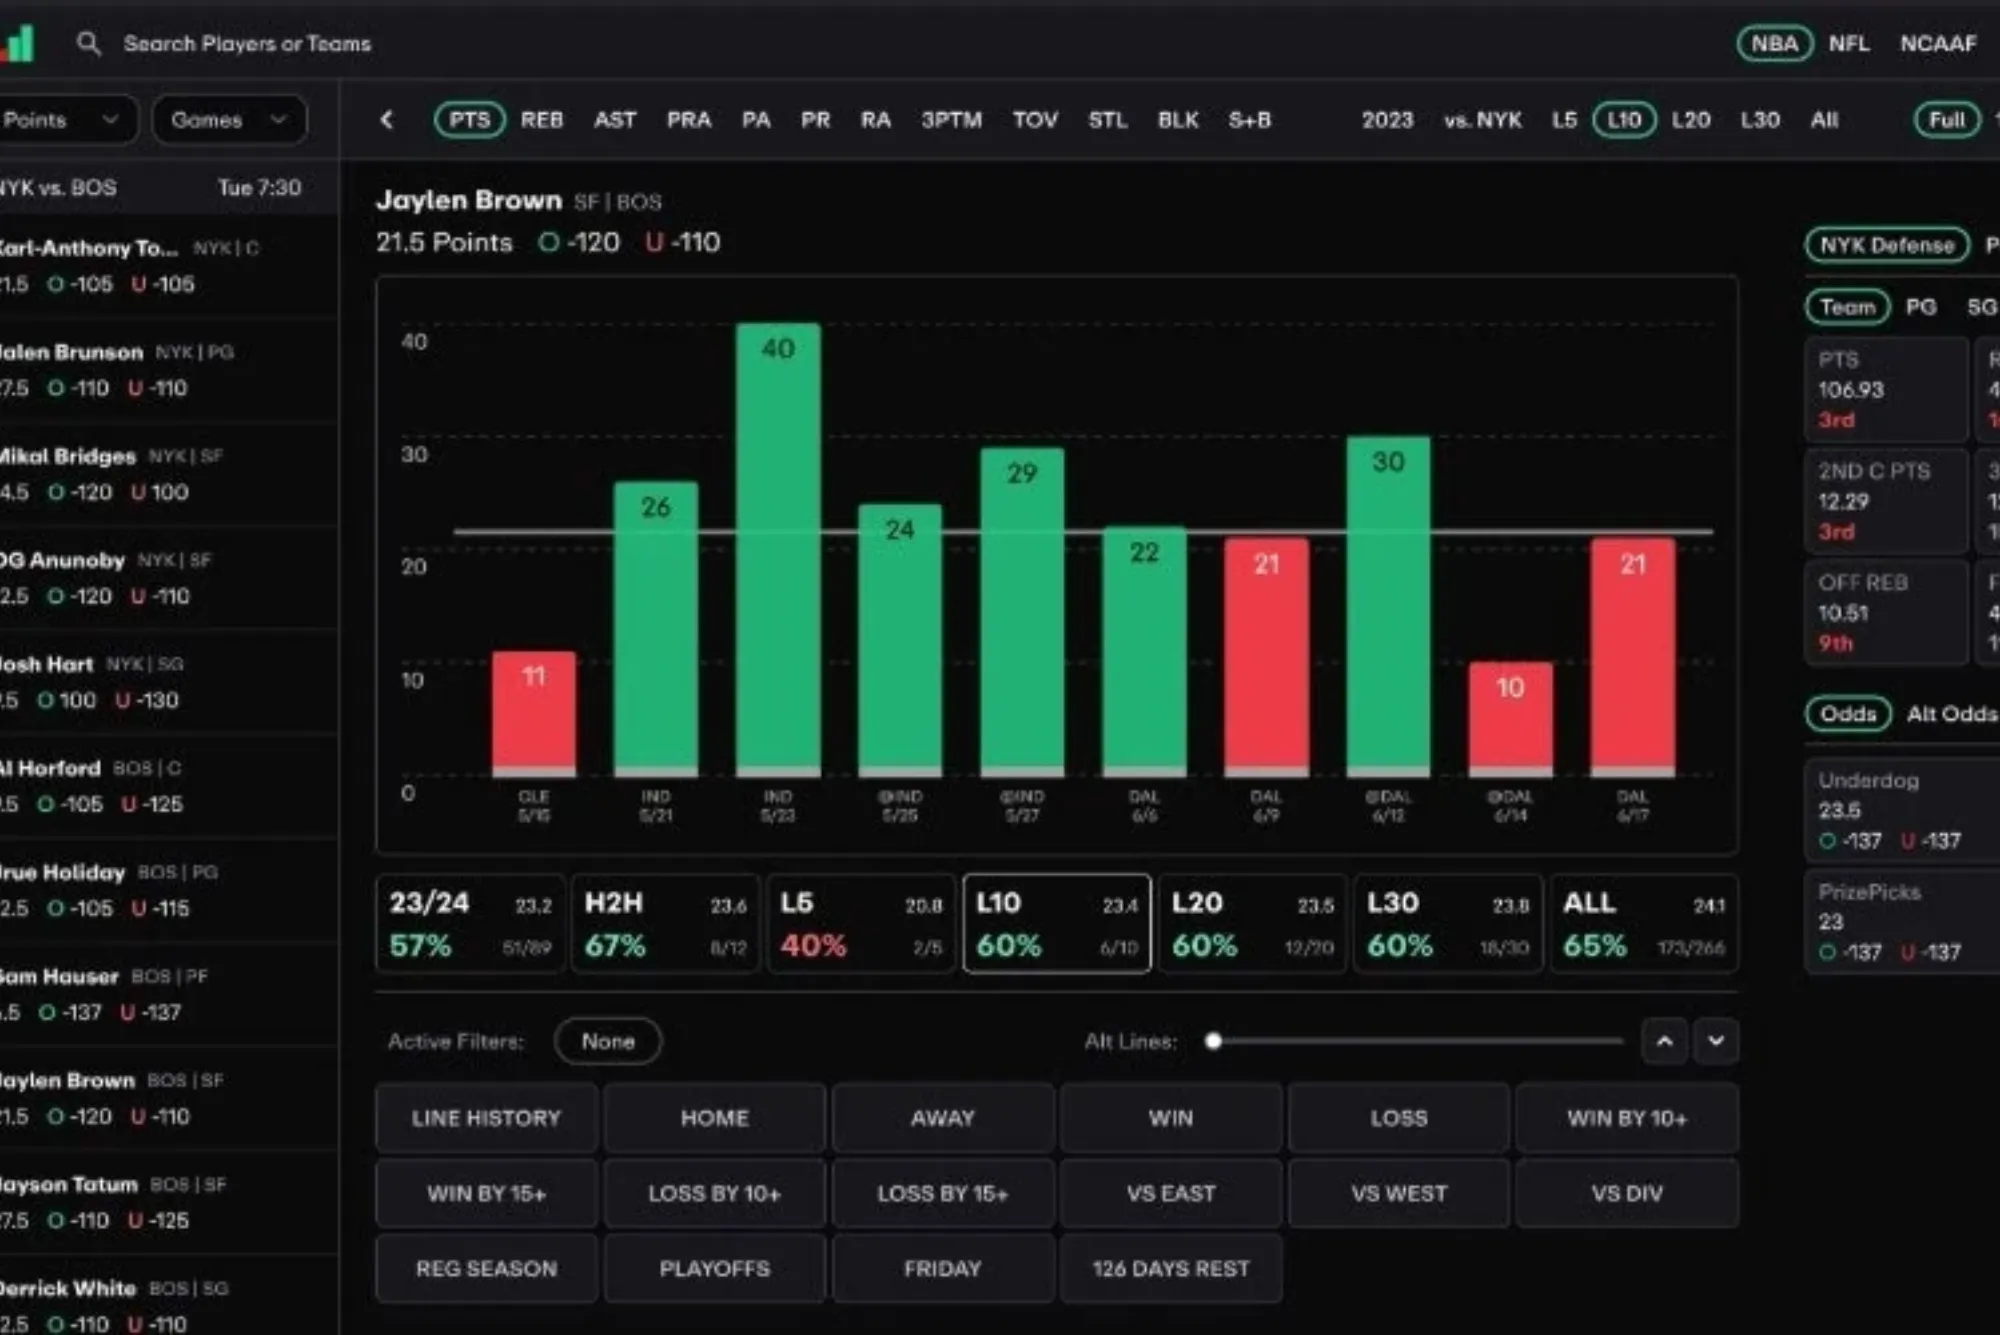
Behind the scenes, sportsbooks rely on sophisticated statistical models and expert analysts. Data points such as recent form, head-to-head history, injuries, weather conditions, and even crowd sentiment feed into algorithms that forecast probabilities.
Understanding Implied Probability vs. True Probability
While odds reveal implied probability, true probability requires your own analysis. For instance, a team frustrated by recent close losses might be undervalued by the public but truly poised for a turnaround. Identifying those discrepancies—where implied probability diverges from your model—constitutes value.
Power Rankings in Practice
I once developed a simple power ranking model for basketball, assigning weightings: 40% to offensive efficiency, 40% to defensive efficiency, and 20% to home-court advantage. Comparing my model’s projections with sportsbooks’ implied probabilities revealed value on underdog picks roughly 18% of the time.
Risk Management: Smart Stake Sizing
Odds only tell half the story. Effective bettors deploy staking plans—flat bets, percentage of bankroll, or more advanced approaches like the Kelly Criterion—to manage risk and maximize long-term growth.
The Kelly Criterion
The Kelly Criterion suggests betting a fraction of your bankroll proportional to your edge:
f∗=bp−qbf^* = \frac{bp – q}{b}f∗=bbp−q
where b is the decimal odds minus 1, p is your assessed probability, and q is 1 – p. While powerful, pure Kelly can be aggressive; many bettors use half-Kelly or quarter-Kelly to temper volatility.
Practical Application
If you estimate a 40% true probability on an event at decimal odds of 2.50 (b = 1.5, p = 0.4, q = 0.6), Kelly suggests betting:
f∗=1.5×0.4−0.61.5=0.6−0.61.5=0.0f^* = \frac{1.5×0.4 – 0.6}{1.5} = \frac{0.6 – 0.6}{1.5} = 0.0f∗=1.51.5×0.4−0.6=1.50.6−0.6=0.0
No edge exists. However, at odds of 3.00 (b = 2.0),
f∗=2.0×0.4−0.62.0=0.1f^* = \frac{2.0×0.4 – 0.6}{2.0} = 0.1f∗=2.02.0×0.4−0.6=0.1
meaning a 10% stake of your bankroll. Using fractional Kelly or fixed-percentage staking reduces risk of ruin and smooths your equity curve.
Leveraging Live Betting and In-Play Odds
Modern sportsbooks offer live betting, where odds fluctuate dynamically based on real-time action. These in-play odds can offer lucrative opportunities if you react faster than the market.
How In-Play Odds Are Calculated
Bookmakers use streaming data on events—possession changes, shot attempts, point spreads—to update probabilities instantly. However, slight data lags or interface delays can open brief windows of value.
Strategy Example
During a recent football match, I noticed the home team dominate possession but struggled to score. Their live win odds dropped to 1.80 while my model still valued them at 2.10. By placing a small in-play bet at 1.80, I locked in value before the market corrected within minutes.
Common Pitfalls and How to Avoid Them
Even experienced bettors fall prey to cognitive biases—anchoring on popular teams, chasing losses, or overestimating their skill. Recognizing these traps is key to consistent success.
Overbetting Favorites
Favorites with odds of 1.20 (implied probability 83.3%) often offer no real value unless you possess insider insight. Chasing these “sure things” typically erodes bankroll through the bookmaker’s built-in edge.
Ignoring Underdog Value
Underdogs frequently present value, especially in volatile sports like tennis or darts. Embracing a contrarian mindset, backed by data, can uncover profitable angles overlooked by the casual bettor.
Conclusion
Mastering how betting odds work empowers you to make smarter, more strategic wagers. By understanding odds formats, calculating implied probabilities, evaluating margins, and employing sound staking plans, you turn betting from guesswork into a disciplined, data-driven pursuit. Whether you’re exploring non GamStop casinos or mainstream sportsbooks, these principles hold true: seek value, manage risk, and continuously refine your edge through analysis and experience.


